Electricity and Water Flow

These images were created by Hiroshi Sugimoto by applying an electrical charge from a 400 000 volt Van Der Graaf generator to photographic film:
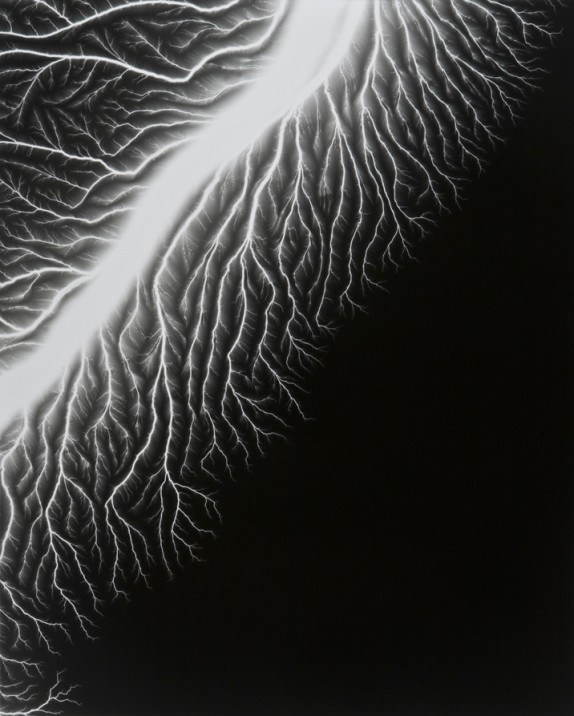
LightningFields1282009-574x716

(via kottke)

They remind me of the output of models of surface water flow in the southwest I used for my thesis research:
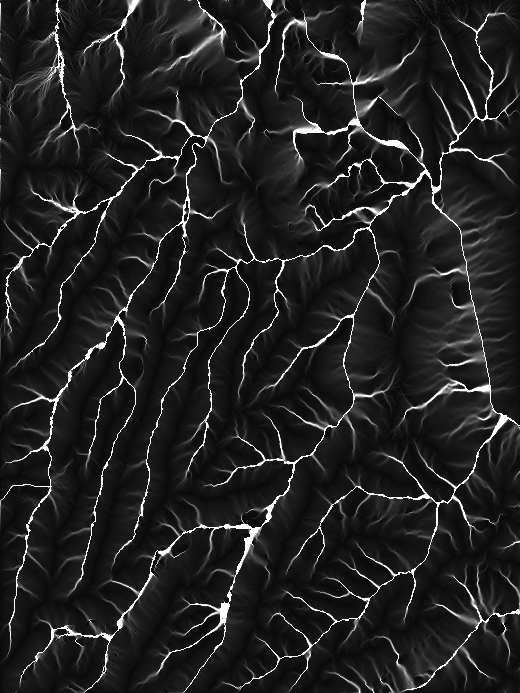
9-15-2009 12-42-05 PM

Visualizing the New York Times, for Example

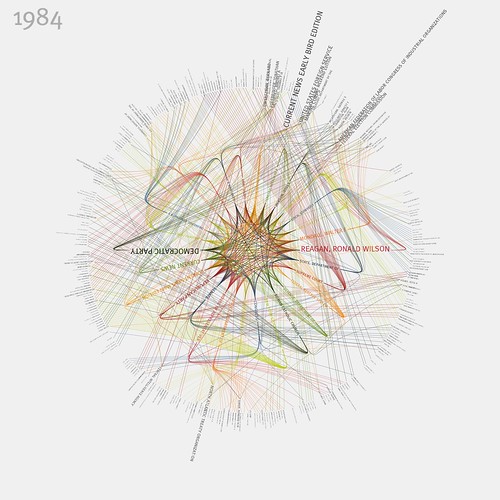
I wanted to post about these amazing visualizations of links between people and organizations in the New York Times. But in the course of looking up their author I discovered that almost everything he creates is that or more amazing, which makes it difficult to choose one example to highlight. Nonetheless, here’s the 1984 version of the NYT viz:

NYTimes: 365/360 - 1984 (in color)

Check it out large, or see the whole set.

Jer Thorp apparently works by visualizing the output of data mining executed on publicly available data streams. He mostly uses Processing to do it, which he calls “an electronic sketchbook for developing ideas”. Interesting. Using information techniques to digest and synergize the increasing amount of public (spatial) data sets is becoming a natural part of GIS, and if I were a more ambitious programmer I might be inspired by this stuff to try and use Processing in a spatial context.

(Also, he appears to have good taste in neighbourhoods.)

The Proposed U.S. High Speed Rail Network

Here’s the high speed rail network that Obama proposed yesterday:


View Proposed USA High Speed Rail Network in a larger map

(I didn’t include the existing NY-Boston line)

As near as I can tell, the Obama administration isn’t actually saying that this is what the final network would look like, they’re just announcing the existence of a competition for some of the stimulus money, and assuming that the projects that will win are the the existing regional propositions. Which makes sense.

For comparison, here’s a map of the existing Amtrak routes from MapMash.

(Sorry, too lazy to fight Google into showing them both on one page. Silly Google.)

A few things I notice:

  • Not many cities which aren’t serviced by existing Amtrak routes would get added. So this would mainly amount to a speeding up of existing services, not new connections.
  • The long sleepy run through the Great Plains isn’t going to get any shorter or invigorating. No high-speed for you.
  • Although it isn’t totally clear from the couple of regional plans I looked at, it doesn’t appear that abandoned rail stations currently lying fallow in towns and small cities on these routes would be re-opened. Viarail in Canada does a better job of keeping smaller stations open than Amtrak does in the US.

So this is principally about speeding up medium-distance inter-metropolis rail travel.

Some people are going to say that we want to encourage a focus on cities, because that’s where economies of scale of people and ideas generate the most rich human existence, as well as the most ecologically sustainable population densities. This plan looks to do that, so those people will be happy.

Other people may argue that further marginalizing the rural areas and their associated small and medium towns and cities isn’t a good idea, when we’re facing a de-stabilization of the food system and probably want to move people back into local adaptable foodsheds. Those people might not be so happy.

I figure if it gets people into trains, that’s naturally going to lead to greater demand for scope and density of connections. High-speed rail on the Northeast Corridor today, regular-speed connections across Nebraska tomorrow.

Bushbuddy and Littlbug Wood Stoves

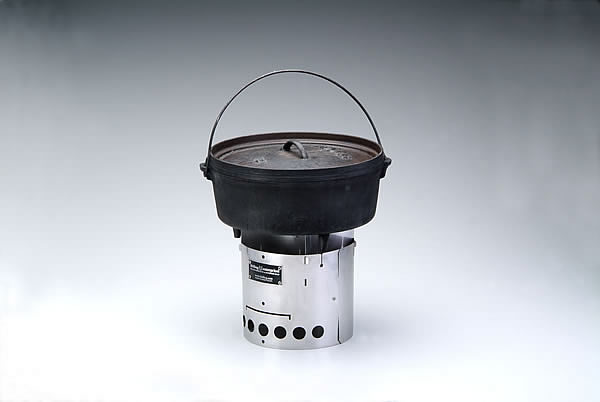
Two wood-burning camping stoves. Both are designed to be light-weight and burn small bits of wood to cook food on the trail. No carried fuel, and unlike the Sierra Zip stove, no battery-driven fan. These may not be good for use in areas where woody debris is so picked-over as to be an ecological problem (I’m thinking parts of the Appalachian Trail, most hiking areas in Southern Ontario), but in lower-human-impact zones they will use far, far less wood than an actual fire. Here’s a post from a ranger claiming he doesn’t object to people using them in no-fire zones.

Both of these stoves are products of the thriving and innovative small-manufacturer direct-sales camping gear scene.

Bushbuddy

Bushbuddy Ultra

Backpackinglight has been selling the Bushbuddy Ultra since BPL editor Ryan Jordan commissioned it for a long-distance arctic hike in 2006. I just figured out that the original Bushbuddy is made and sold in Canada. And, they’ve redesigned the cheaper, more robust, slightly heavier “original” model to be lighter than it was, but still cheaper. So there you go.

The Bushbuddy has a two-wall design to preheat the air supply, which they claim lets it burn “as clean as a candle”, more efficiently, and perhaps most importantly to a westerner, with wetter wood. 6.5oz for the $100CDN redesigned Bushbuddy basic, 5oz for the $120CDN Bushbuddy Ultra. Or, if you’re in the US and know that import duties are high, get it from Backpackinglight for $140USD (a little cheaper if you’re a BPL member).

Update: Fritz from F.H. Enterprises emailed to say that there should be no duty charged going into the U.S. and to point out that at the exchange rates at time of publication, that makes for about $79USD, including shipping.

Littlbug

seniorstove_image46

If the Bushbuddy is too high-tech for you, the Littlbug is a similar thing with an even less engineeered design. Comparable weight, plus it breaks down and nests (in a good way). Not dual-wall, so perhaps that effects performance. Appears a little more durable, and they’re substantially cheaper. $60USD for the 5.1oz “junior”, and there’s a 16oz “senior” for the youth-group community for about the same price. Note however that the Bushbuddy has a closed bottom to reduce scarring, and the Littlbug would need the 9oz/$25USD firepan for the same function. Note also that the firepan comes bundled with a hanging chain, in case you want to have a suspended “self-centering” fireplace, or you could buy two for campsite poi twirling.

Boil times:

According to their respective websites, the Bushbuddy will boil 1 liter of water in 8-10 minutes, and the Littlbug Jr. will take 4-6 minutes for the same operation (they use American water, which only comes in quarts, but it’s very similar). Interesting, although a side by side comparison controlling for ambient and water temperatures, altitude, wood type and fire making technique might yield different results either way.

Gearshed Analysis:

If you’re concerned about the energy your stove will consume in reaching you, and concomitant climate-altering carbon emissions, I have prepared a rough map of the gearshed boundary of the two devices. The Bushbuddy is made in Iskut (!) BC by Fritz, the Littlbug comes from Kent and the individuals with disabilities he employees in Bemidji Minnesota.

Note that this is only a first-order analysis, and does not account for road networks or flight paths, border effects, idling times, switching costs, or aesthetic factors. You may wish to conduct your own analysis. Note also that if you buy the Bushbuddy from Backpackinglight, it will be traveling twice. Note also also that the closer to the line you are, the less it really matters. Not that Calgarians would care, anyway.


View Gearshed: Bushbuddy v. Littlbug stoves in a larger map

(If that line looks a little off-center, it’s probably because Google Maps displays in a Mercator projection, which isn’t so hot for area-distance relationships.)

This is not a review: I have not used either of these stoves (I’m still in a love/hate relationship with my alcohol stove). If anyone has first-hand experience they’d like to share, please comment.

Update 2:Kent contacted me and is sending a unit for review, and it turns out that a friend of mine has a Bushbuddy, so once I have both in my hands I’ll make a new post comparing and contrasting the two. Watch this space. And please, leave your own comments!

The Long Road to Linux

I don’t remember the first time I installed linux. The earliest memories I can still call on are of installing a version of RedHat on the Dell laptop I used for the last year of undergrad. I was using the same physical setup I do today: a laptop plugged into an external monitor, with attendant mouse/keyboard and stereo system. I was having trouble getting it working with the external monitor, and hand-editing fstab files in root, and so on. At one point I pressed the FN-F7 combination to switch the display over from the monitor screen to the laptop screen, and heard a delicate “pop”, and the laptop screen flashed white, and stayed that way. I guess I had summoned a little too much current through the display adapter. Linux was willing to let me channel that extra power to my laptop screen, even if the screen couldn’t really handle it. Linux does what it’s told. My laptop screen never worked again, although I carried the damn laptop around for years, using it with an external monitor.

Every year or so since, I’ve checked back into the world of GNU/linux to see if the time has yet come when the evergreen promises of grandmother friendliness, or at least non-CS-student friendliness, have come true. They never have yet, although they really do get closer every year. Ironically, it was Windows XP’s inability to consistently link my laptop and monitor’s display that most recently drove me back into linux-land. These days, Ubuntu is the hotness, and it is indeed getting close to general-purpose usability. I have a list of must-haves before I switch fully over, and Ubuntu 8.10 (“Intrepid Ibex”) crosses several of those needs off the list:

A working “suspend” mode.

  • This capacity is not only present in “Intrepid”, it occasionally works, unlike previous releases. But not always.

The ability to use a laptop screen with an external monitor, preferably at the same time.

  • This is working a charm in Intrepid. And doing it better and more stably than Windows XP, in fact.

The ability to use an external soundcard.

  • Baked right in. I didn’t even have to configure it. The first time Ubuntu loaded up, it played the logon sound through my full stereo system.

So most of the hardware stuff seems to be getting ironed out. If only the same could be said for software.

Music management.

  • Not music playing, mind you. There are now plenty of open source, linux-native music players, many of them as good or better than the iTunes standard, and all of which will treat your system with more respect. I like Listen, Amarok, and Songbird very much for the playing of music files. But none of them seriously pretend to be music managers. What I need is something to replace MediaMonkey. To be fair, there is really only one software in the world that does persistent monitoring, user-controlled auto-file-organization and mass-metadata-manipulation of music files stored across disparate directories and harddrives well (i.e., MediaMonkey). But until linux has a MediaMonkey equivalent (or MediaMonkey itself), yo soy Windows-locked. Songbird, are you guys listening?

Photographic workflow.

  • Similar to the situation with music, there are good linux-based applications available to display (and edit) photos, but not to manage them. GIMP never stops improving as an image editor, although it still doesn’t seem to quite keep up with Adobe in that regard. But for workflow: cataloging, mass-editing of metadata, and so on, there just isn’t anything to replace or even touch proprietary, non-linux programs like Lightroom.

Easy software installation.

  • This is one where linux now wins, hands down, no contest. Once upon a time, installing software on linux was an overwhelming task. Lots of open source software build on bits and pieces of existing software to make something new: that’s one of the great advantages of working in open source, you can just do that. It’s encouraged. Unfortunately, if you want to install a little proggy that happens to depend on 4 other proggys, each of which depend on a few others… insanity lurks low over your poor head. But the linux-people fixed that years ago, and oh how they fixed it. The first time you try to install software in a linux environment can be confusing, because it’s so different than Windows (or Mac). But after that first time, it’s hard to go back. Trust me, try it. And you won’t have to reboot, either.

GIS tools.

  • I could be wrong about this one soon enough. I know there are many smart people working days and weekends on moving open-source GIS towards being the ESRI-killer we so desperately want and need. But for a general purpose spatial analysis workstation, you still today need ArcGIS, and that means you still need Windows.

Science and stats tools.

  • R runs in linux of course, and so if you have the R skills, statistics is covered. But if you don’t have the R skills (and who does?), you’re screwed. And for all those random sciencey applications for habitat modeling, or PCR analysis, or radio collar telemetry, or what have you, there’s only a chance that someone will have released a linux version.

For many of these complaints there exists an active project holding out hope of an eventual solution. For none of them is that solution going to arrive in the next point release. In some cases, the solutions are probably several years away from being equal to the respective Windows options.

This is not a pejorative complaint about GNU/linux. I understand that the entire ecosystem of open-source software is an extraordinary volunteer effort and an exemplar of non-profit capacitance, and it has not ceased to blow my mind that linux exists at all, never mind whether it fulfills my personal computing needs. And I think it will happen: a few years ago basic configuration and operation of linux was still an esoteric enough excercise that it wasn’t great even for basic internet and word processing, and that has since changed. But it looks like a few more years until I can freely download a full bodied multimedia processing and scientific analysis workstation. The road is longer than I had hoped a decade ago. But we’ll get there one fine day.

Google Earth Gets Oceans, Time

Major upgrades to Google Earth getting rolled out today. For one, oceanic surfaces will be explorable in the same way that terrestrial ones have been.

Not getting as much press, but more exciting to me, is a new ability to scroll through time, seeing changes in landcover through history. Currently, custom data can be time-stamped and viewed as a temporal animation, but the landcover data that is the core of the Google Earth viewing experience has not taken advantage of that ability. Visualizing landcover change is fundamental. Being able to see how things used to be can shift perspective completely on how things are today. Watching that change might yield a sense of trajectory, adding a feeling of dynamism and potential.

Generally, western reductionist science drops the ball on understanding the world as an ever-changing place. We tend to describe the world and it’s systems as as a series of isolated static snapshots, and I think that way of thinking either leaks out from science into broader cultural understanding, or maybe leaked in from it. As Dean Bavington would say, we need to tell stories about flows, not just stocks.

Of course, stories about flows in landcover and human footprint requires having a time series of data, and that’s challenging both from an archival and technical viewpoint. I haven’t played with it yet, it will be interesting to see just how many mountains the Google Earth people have moved to make it workable.

According to the New York Times:

“By choosing among 20 buttons holding archives of information, called “layers” by Google, a visitor can read logs of oceanographic expeditions, see old film clips from the heyday of Jacques-Yves Cousteau and check daily Navy maps of sea temperatures.” —Google Earth Fills Its Watery Gaps

10 points to anyone who can remember the name of the guy who carried the onion-skin “layers” overlay metaphor into a computerized GIS context. It’s escaping me now, but I’m pretty sure it wasn’t “Google”.

Vegetation Self-Patterning Presentation

I gave a presentation of my research on southwestern plant patterning yesterday–this was in fact an “oral dissertation defense”, according to the Masters Project Handbook. Below is a video, and the slides. I’ll hopefully be adding more material to the research page as I get around to it, including a NetLogo implementation of an existing vegetation model and possibly a Google Earth tour of some of the sites and data. First however I have to finish writing the non-oral part of the thesis.

Slides (6mb pdf)

Narrative summary of the talk:

Self-patterning of vegetation has been identified in dryland ecosystems worldwide, such as the “tiger striped” savanna of the African Sahel and the banded shrublands of Australia. In these water-limited systems plants are organized into consistent spatial structures by the facilitation of new growth in the organic shadow of existing plants. These landscapes are theorized to be more efficient at retaining rare rainfall, but are also expected to undergo catastrophic shifts if precipitation drops below difficult-to-predict thresholds.

No such banded systems have been identified in America, but I was curious if more subtle patterning could be happening in southwestern drylands which share many of the same ecosystem characteristics and display threshold response to changes in precipitation. If a form of emergent patterning were occurring in these ecosystems, it would have implications for predicting landscape response to pending changes in climate. Focusing on pinon-juniper woodlands in Arizona and New Mexico, I mapped the shapes of patches of vegetation from aerial photographs and measured their degree of spatial pattern. Estimates of surface water movement and distribution were developed for the same sites from digital elevation models. Testing the spatial correlation of these landscape characteristics indicated strong linkages between vegetation patch shape, vegetation density, and surface water hydrology. In sites in Arizona, these relationships were consistent with theories of self-patterning, suggesting that this previously unidentified phenomenon could be occurring in in an American dryland landscape.

Very Large Area-Weighted Mean Shape Index Formula

Where i is a very large patch class; n is the very large number of patches of class i; j is the very large number of patches of all classes; p is the very large perimeter of patch ij; and a is the very large area of patch ij.

Localized Explanatory Power of Soil Water for Shapeness of Juniper

Hexes: Mean Shape Index of Juniper canopies north of Strawberry Crater.
Centroids: local R2 of a geographically-weighted regression model linking MSI to modeled accumulated soil water.

A Better Plan

I’ve updated my research plan, again. It’s becoming a hobby. Now with improved narrative, and references to attest to its scholarly character.

arid vegetation in volcanic matrix

← newer posts · older posts →