Math-Checking the Carbon Pledges
President Obama today announced that he’ll be going to the Copenhagen climate talks, and that he’ll be taking an emissions cut pledge with him. That would be a 17% cut from 2005 levels by 2020. It’s great to hear a US leader setting quantitative targets.
There are a few caveats:
- the President doesn’t get to pass laws and congress hasn’t committed, so it’s not clear how he can make a unilateral pledge
- he’s going to the start of the talks, rather than the end, which is when all the rest of the leaders are supposed to hang out
I’m happy to look past those. Setting targets and filling in the details later beats nothing, and what the hell ever happens at leader’s photo-ops anyway? But there’s one more
- that’s a 17% cut from 2005 levels
When countries announce emissions reductions, they almost always either baseline them against 1990, or some time in the last few years. If they pick 1990, it’s because they’re serious and they want to use the same standard that’s been in play since the days when the Kyoto Treaty was being formulated. Using 1990 means you can compare it against everybody else’s reduction commitments, since they’re all using 1990 levels as well.
Except for that second group, who will use a recent year, like 2005 or 2006. Some time just long enough ago that emissions data is firmly on record, but recent enough that the proportional calculation includes all the increases in emissions that have gone on since we were supposed to get serious about reductions back in the ’90s. Obama has chosen to be in that second group.
How about Canada? We’ve pledged (also without saying how we’re going to do it) 20% cuts from 2006 levels. Second group. Short bus.
Hard to sort out what all those numbers mean: 20% vs. 17% of two different emissions levels, 1990 vs 2005 vs 2006. Luckily, Stephen Wolfram’s massive ego begot Wolfram Alpha for exactly this sort of operation.
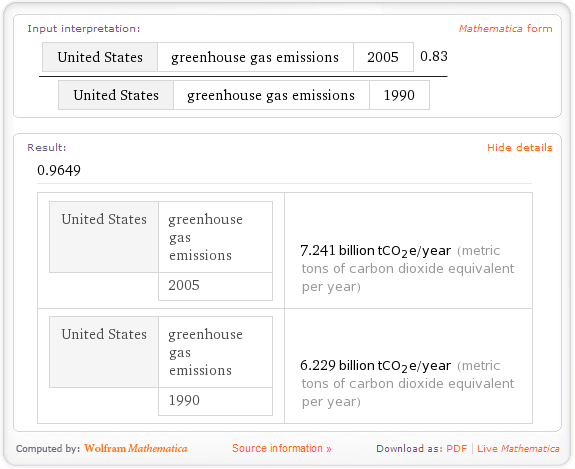
So, Wolfram Alpha, if the U.S. cut its greenhouse gas levels to 17% of what it emitted in 2005, what proportion of the amount emitted in 1990 would that be?

If Wolfram’s data is correct and the U.S. followed through on this current pledge, by 2020 the nation would be emitting 97% of the greenhouse gases released in 1990. That’s a 3% cut against 1990 levels, to compare with the 20 to 30% the European Union has pledged, for example. Keep in mind, by 1990 we had already realized that greenhouse gas levels were too high to maintain a stable climate. And by 2020 we will have had yet another decade of destabilization. I’m still glad he’s setting targets, we may well need to take a few baby steps before we start walking somewhere useful. But that’s not fully reassuring, yet.
What about Canada? Environment Minister Jim Prentice is tickled that Canada and the U.S. are “harmonizing” their responses, regardless of their quality. He’s pointing out that the targets are oh-so-close to each other. Great! But if we want to use the 1900 baseline, just how close our targets are would depend on how we compare with regards to relative increase in emissions since then. Let’s check.
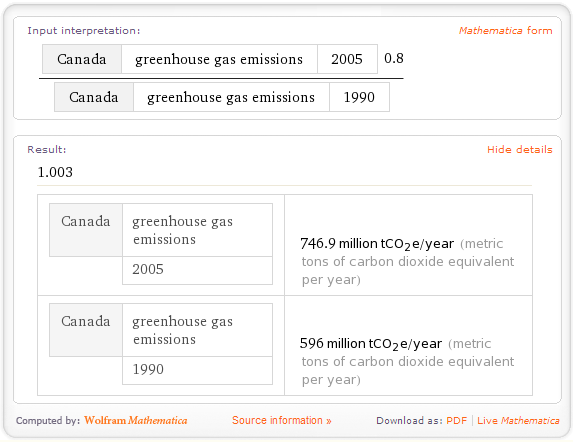
Unfortunately, Wolfram Alpha’s greenhouse emissions data only goes up to 2005, so we’ll have to fudge the Canadian calculation a little and run it against 2005 data instead of the 2006 that the government is using in their calculations. That said, here goes:

That’s 100.3% of our 1990 emissions (assuming again that the data is correct). Very close to the U.S. commitment, yes. We’ve just very classily managed to commit to nudging our emissions commitment a teeny bit higher than the 1990 amounts that were scary back then.