The Upside of Environmental Complexity

Just bought a sockeye salmon off the dock at Granville Island. Hook-and-line caught in the ocean the evening before, gutted when it was brought in to the boat, and because we didn’t mind a little seal bite we got the big one for the regular price.
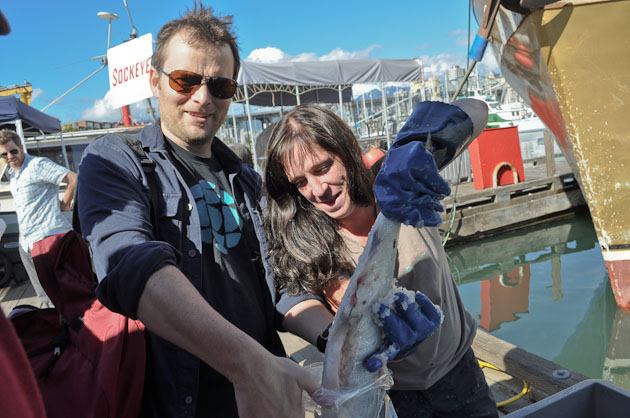
receiving the sockeye

According to the bathroom scale we paid about the same per pound as we would for factory farm hamburger, which is a somewhat sad economic consequence of the magnitude of this year’s incredible sockeye run. My complex systems teacher once made the point that at a certain scale, complex systems can be effectively equivalent to chaotic systems. Viewed from the commercial dock at Granville Island, the 4 year oceanic salmon cycle sure seems chaotic.
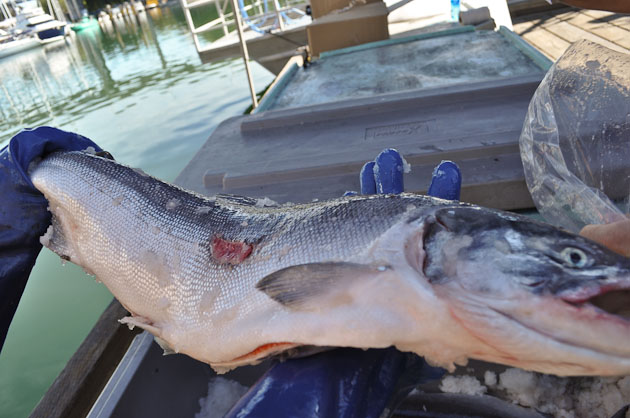
seal bite
seal bite

And tasty. We’ve never cooked salmon before, but we’re figuring on grilling up a chunk of it on bbq tonight with a little lemon.

Update: and that was exactly what we did.

We’ve Chosen Not to Know What is Causing Salmon Decline

This is painful: It looks like we may not have the data needed to explain the pacific salmon collapse because of politically motivated cuts to research, going back perhaps 30 years. It’s hard enough to understand ecosystems even when we have resources to do the science.

No answers in B.C.’s sudden salmon collapse — Canadian Press, in the Globe and Mail

This has been a frustrating tale for a long time now. The government refuses to take on the research, disregards or even deliberately interferes with non-gov scientists who try to do it on their own, and then dismisses criticism from non-scientists by pointing out that there’s insufficient scientific proof. It may be that fish farms aren’t to blame for this round of salmon decline, so it’s somewhat ironic that the media is picking this moment to wake up to the sea lice story. Of course there’s no knowing what the cause is either way. And now that the fish farms are well established and oceanic temperatures and acidity levels are likely to remain unstable, it will be hard or impossible to set up well controlled experiments to find out.

Roll You Own Supercomputing Cluster

Amazon has activated a beta version of a new “Elastic MapReduce” service. The naming is a little obscure, but it looks like it’s essentially the Hadoop distributed computing framework running on their existing “Elastic Compute Cloud“, which is a distributed virtual computing environment running in turn on top of their Simple Storage Service, which is distributed server network. In other words, Elastic MapReduce is a huge, amorphous operating system designed for large computation tasks like web indexing or heavy science, running on top of a huge, amorphous processor and harddrive farm.

Calling these things “elastic” is Amazon’s way of pointing out that you can buy any amount of operating system/processor/storage that you care to pay for, as little or as much, with the only notional limit being the entirety of Amazon’s many large data center buildings. No fuss, no muss, give them some money and you can run your computing application for a while. Give them more and you can run it faster, longer, bigger. All you need is an internet connection to interface with it all. They won’t bother you with details like what state of the union your processes are running in, or on what hardware, or how many people are employed servicing it and swapping out burnt out drives and sweeping up the diet pepsi cans left by the programmers. It’s commodity supercomputing.

I wonder if I had been aware of this option if it would have changed how I structured my thesis research. Maybe I could have got another little research grant and bought myself $1000 worth of supercomputing (I don’t actually know how much supercomputing that would be). What could I have done with it? Then again, most of the software I ran for that project is Windows-only and presumably locked out of hadoop clusters. ArcGIS, Imagine, fragstats, patch analyst, Terrain Analysis System, GeoDA, all Windows and Windows only. Landscape ecology really needs to get off the Windows, it doesn’t scale.

Vegetation Self-Patterning Presentation

I gave a presentation of my research on southwestern plant patterning yesterday–this was in fact an “oral dissertation defense”, according to the Masters Project Handbook. Below is a video, and the slides. I’ll hopefully be adding more material to the research page as I get around to it, including a NetLogo implementation of an existing vegetation model and possibly a Google Earth tour of some of the sites and data. First however I have to finish writing the non-oral part of the thesis.

Slides (6mb pdf)

Narrative summary of the talk:

Self-patterning of vegetation has been identified in dryland ecosystems worldwide, such as the “tiger striped” savanna of the African Sahel and the banded shrublands of Australia. In these water-limited systems plants are organized into consistent spatial structures by the facilitation of new growth in the organic shadow of existing plants. These landscapes are theorized to be more efficient at retaining rare rainfall, but are also expected to undergo catastrophic shifts if precipitation drops below difficult-to-predict thresholds.

No such banded systems have been identified in America, but I was curious if more subtle patterning could be happening in southwestern drylands which share many of the same ecosystem characteristics and display threshold response to changes in precipitation. If a form of emergent patterning were occurring in these ecosystems, it would have implications for predicting landscape response to pending changes in climate. Focusing on pinon-juniper woodlands in Arizona and New Mexico, I mapped the shapes of patches of vegetation from aerial photographs and measured their degree of spatial pattern. Estimates of surface water movement and distribution were developed for the same sites from digital elevation models. Testing the spatial correlation of these landscape characteristics indicated strong linkages between vegetation patch shape, vegetation density, and surface water hydrology. In sites in Arizona, these relationships were consistent with theories of self-patterning, suggesting that this previously unidentified phenomenon could be occurring in in an American dryland landscape.

Very Large Area-Weighted Mean Shape Index Formula

Where i is a very large patch class; n is the very large number of patches of class i; j is the very large number of patches of all classes; p is the very large perimeter of patch ij; and a is the very large area of patch ij.

A Better Plan

I’ve updated my research plan, again. It’s becoming a hobby. Now with improved narrative, and references to attest to its scholarly character.

arid vegetation in volcanic matrix

Photos from Southwestern Research

2 months ago I was wandering around in rented cars, waking up to the dawn in improvised Forest Service campgrounds, cooking up bacon and eggs and coffee on camp stoves, breaking down my tent then rushing out into the piƱon-juniper woodlands with a gps antenna magneted to my bandanna, a compass around my neck and a camera in my hand, documenting the landscapes that were going to become my study sites. I would drive and hike around in a rush to look at things until I decided I had to look at something in particular very slowly. Then I would stare at it. Mostly bushes and trees and soil and water courses. Also hills and valleys. I visited Sierra Vista and Tombstone and Arizona and Flagstaff and Cedar Ridge and Tuba City, and mostly places in between, like Cochise County and the San Pedro River and the Coconino forest and Waputki and the Little Colorado canyon and the rangelands of Navajo Nation. I took a train to New Mexico and did similar things there. Then I took a train home. It was a good time. There was a lot I missed because I was in a hurry to look at semi-arid vegetation, but there was a lot I saw because I was looking for semi-arid vegetation. I wrote about it a bit here.

Because I had a camera in my hand and because New Mexico and especially Arizona are so damn visual, I took a lot of photos. I’ve finally posted some of them up here.

rental car in coconino rangeland

GIS Art from the Drylands

I’m pleased to see that my research has started to produce some GIS art.

Below: Coconino Juniper Patches with Landscape Shape Index Overlay. Media: Patch Analyst on isodata classification of 1m orthoimagery.

Research Plan

For the curious, I’ve posted a more detailed version of my thesis research plan. Which is currently being executed.

Also, I’m nearly done developing some of my photos from my summer research trip, and that gallery will be up soon.

coconino forest from the high road

Celebrating An Ecologist I Don’t Quite Know

Chris Darimont is a wolf researcher who used to hang out with some of the people I used to hang out with in Victoria. As a wolf researcher, he claims traditional pride of place amongst the tribe of ecologists. As such, your contemporary future-looking ecologist might be tempted to disparage him as a megafauna fetishist, but I gather he actually does some interesting, post-Mowat research.

So it’s nice to see that the Government of Canada has equipped him with an NSERC grant and posted him off to Southern California. Other NSERC fellows I have known have found great success in these United States before returning to enrich the Dominion. And Chris is drawn towards the human side of the picture, so good luck with that, I’ll follow when I figure the I’m up for it.

older posts →